
If you were expecting Nike to falter in its past fiscal year, you thought wrong, but Nike did miss analysts’ consensus estimates.
According to NDP’s Matt Powell, Nike’s fourth quarter U.S. sales were flat. However, what’s really amazing is this: the Nike, Inc.’s sales last year totaled $32.5 billion. That equates to $89 million per day, $3.7 million per hour, $62,000 per minute, and $1,000 per second. Another interesting stat: Nike spent $3.278 billion in “demand creation” last year, just a little less than all of Under Armour’s sales last year of $3.96 billion. Additionally, Nike stock was up 2.5% yesterday morning, but that could be attributed to the fear of Brexit winding down. The Swoosh brand is doing just fine.
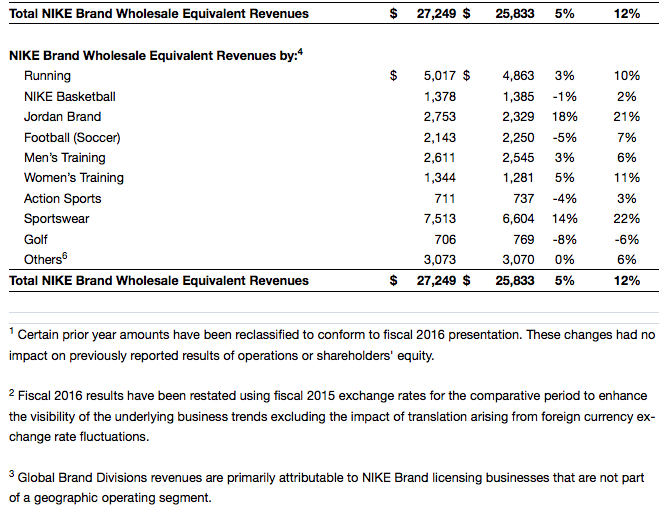
Jordan Brand is in no trouble either. Powell says that the Jumpman is up 21% to $2.750 billion — that’s about 10% of Nike’s sales. Just imagine how much of that is just Retro.
Here’s the full fiscal report from Nike.
-
Fourth quarter revenues up 6 percent to $8.2 billion; 9 percent growth excluding currency changes
-
Fourth quarter diluted earnings per share flat to prior year at $0.49
-
Fiscal 2016 revenues up 6 percent to $32.4 billion; 12 percent growth excluding currency changes
-
Fiscal 2016 diluted earnings per share up 17 percent to $2.16
-
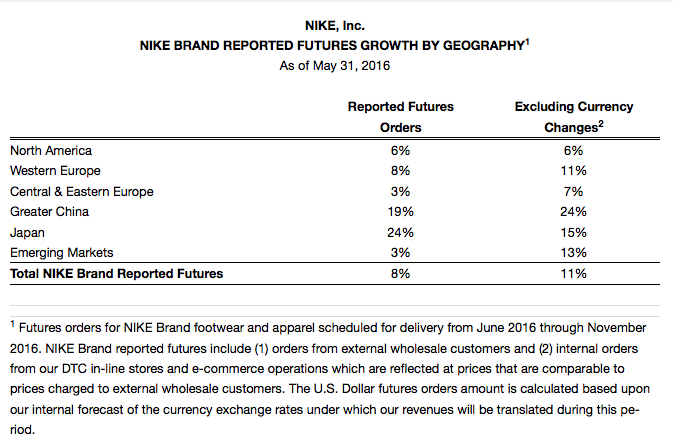
Worldwide futures orders up 8 percent; 11 percent growth excluding currency changes
-
Inventories as of May 31, 2016 up 12 percent
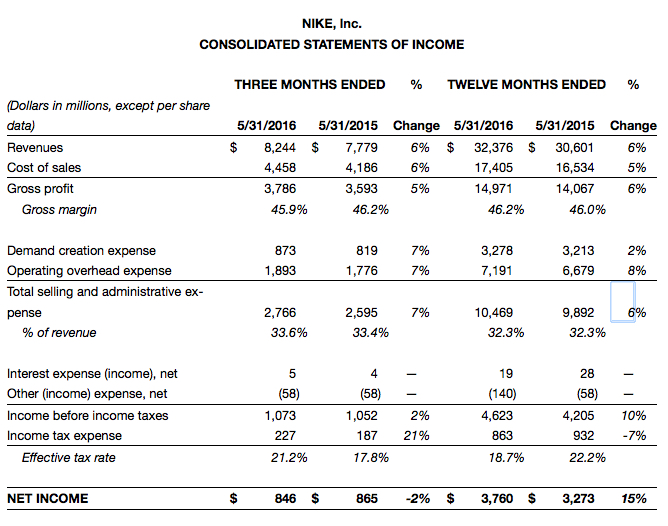
BEAVERTON, Ore., June 28, 2016 – NIKE, Inc. (NYSE:NKE) today reported fiscal 2016 financial results for its fourth quarter and full year ended May 31, 2016. Strong global demand fueled revenue increases across nearly all geographies in fiscal 2016, while robust international revenue drove growth in the fourth quarter. Diluted earnings per share for the quarter were $0.49 as international momentum and a lower average share count were offset by a higher tax rate; a gross margin decline partially due to the clearance of excess inventory in North America; and higher selling and administrative expense. Fiscal 2016 diluted earnings per share rose 17 percent to $2.16, reflecting revenue growth of 6 percent, gross margin expansion, a lower tax rate and a lower average share count.
“Our consistent growth is fueled by innovation, which is why fiscal 2016 was such a breakthrough year for NIKE in everything we do,” said Mark Parker, President and CEO, NIKE, Inc. “From product to manufacturing to how we serve our consumers – more personally and at scale – we’ve raised the bar of what’s possible. It’s a great time to be in sports, and the NIKE Brand has never been stronger. Fueled by our unrivaled roster of athletes, fiscal 2017’s calendar of sport moments promises to build on our business momentum and inspire consumers.”*
FOURTH QUARTER INCOME STATEMENT REVIEW
Revenues for NIKE, Inc. rose 6 percent to $8.2 billion, up 9 percent on a currency-neutral basis.
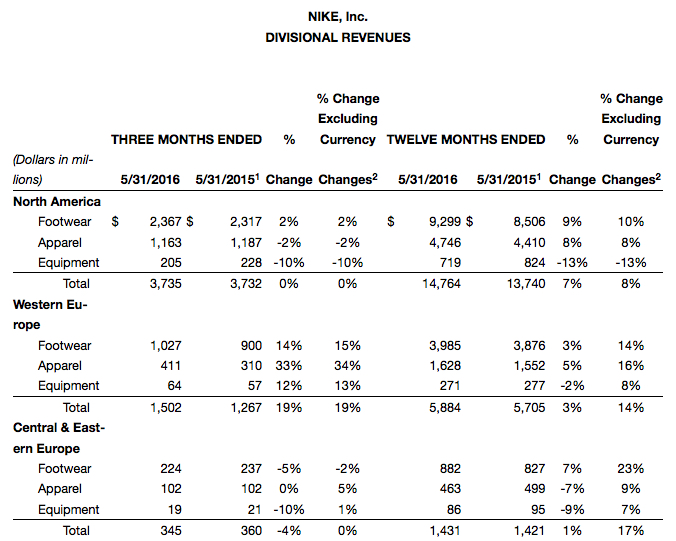
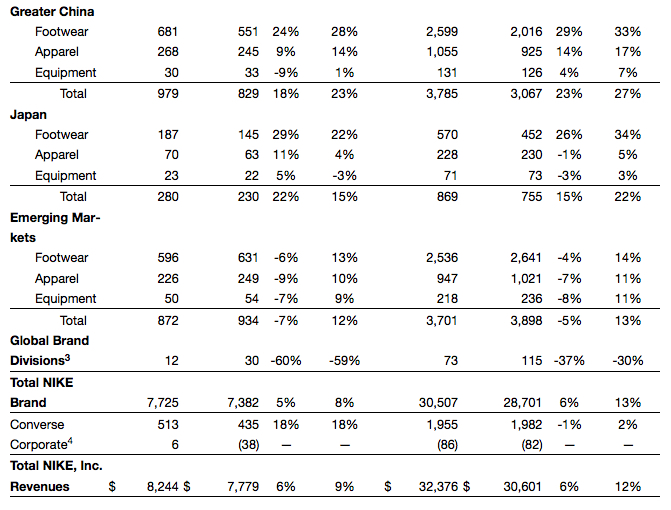
Revenues for the NIKE Brand were $7.7 billion, up 8 percent on a currency-neutral basis driven by double-digit growth in Western Europe, Greater China, Emerging Markets and Japan, including strong growth in Sportswear, Global Football and the Jordan Brand.
Revenues for Converse were $513 million, up 18 percent on a currency-neutral basis, mainly driven by a major system go-live that accelerated orders from the fourth quarter to the third quarter in the prior year.
Gross margin declined 30 basis points to 45.9 percent as higher average selling prices were more than offset by higher product costs, the negative impact of clearing excess inventory in North America and unfavorable changes in foreign currency exchange rates.
Selling and administrative expense increased 7 percent to $2.8 billion. Demand creation expense was $873 million, up 7 percent, reflecting investments in digital demand creation, sports marketing and brand events which were partially offset by lower advertising expense. Operating overhead expense increased 7 percent to $1.9 billion, reflecting continued growth in the Direct-to-Consumer (DTC) business, and targeted investments in operational infrastructure and consumer-focused digital capabilities.
Other income, net was $58 million, primarily comprised of net foreign currency exchange gains. For the quarter, the Company estimates the year-over-year change in foreign currency-related gains and losses included in other income, net, combined with the impact of changes in exchange rates on the translation of foreign currency-denominated profits, decreased pretax income by approximately $66 million.
The effective tax rate was 21.2 percent, compared to 17.8 percent for the same period last year, primarily due to adjustments in the prior year to reduce tax expense recognized in the interim quarters of fiscal 2015 on intercompany transactions.
Net income decreased 2 percent to $846 million as revenue growth was more than offset by lower gross margin, higher selling and administrative expense and a higher tax rate, while diluted earnings per share remained unchanged from the prior year at $0.49 reflecting a 2 percent decline in the weighted average diluted common shares outstanding.
FISCAL 2016 INCOME STATEMENT REVIEW
Revenues for NIKE, Inc. rose 6 percent to $32.4 billion, up 12 percent on a currency-neutral basis.
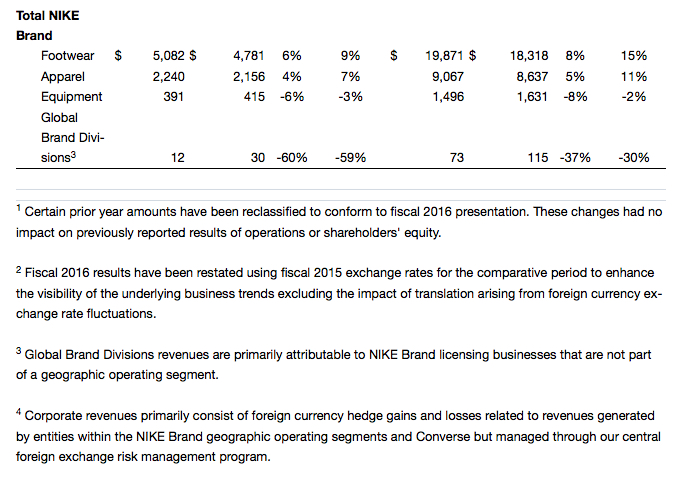
Revenues for the NIKE Brand were $30.5 billion, up 13 percent excluding the impact of changes in foreign currency.
NIKE Brand sales to wholesale customers increased 9 percent on a currency-neutral basis while DTC revenues grew to $7.9 billion, up 25 percent excluding the impact of changes in foreign currency, driven by a 51 percent increase in online sales, the addition of new stores and 10 percent growth in comparable store sales. As of May 31, 2016, the NIKE Brand had 919 DTC stores in operation as compared to 832 a year ago.
On a currency neutral basis, NIKE Brand revenue growth was driven by robust growth in every geography as well as most key categories including Sportswear, Running and the Jordan Brand. Our Men’s, Women’s and Young Athletes’ businesses all grew double-digits.
Revenues for Converse were $2.0 billion, up 2 percent on a currency neutral basis, mainly driven by strong growth in the United States and Asia Pacific, slightly offset by lower sales in Europe.
Gross margin expanded 20 basis points to 46.2 percent primarily driven by higher average selling prices and growth in the higher margin DTC business which were partially offset by higher product costs, the negative impact of foreign currency exchange rates, and the impact from clearing excess inventory in North America.
Selling and administrative expense grew 6 percent to $10.5 billion. Demand creation expense was $3.3 billion, up 2 percent, reflecting investments in DTC marketing, brand events and sports marketing, which were partially offset by lower advertising expense. Operating overhead expense increased 8 percent to $7.2 billion due to the expanding DTC business, and targeted investments in operational infrastructure and consumer-focused digital capabilities.
Other income, net was $140 million for the fiscal year, mainly comprised of net foreign currency exchange gains. For the year, the Company estimates the year-over-year change in foreign currency-related gains and losses included in other income, net, combined with the impact of changes in currency exchange rates on the translation of foreign currency-denominated profits, decreased pretax income by approximately $423 million.
The effective tax rate was 18.7 percent, compared to 22.2 percent in the prior year, primarily due to an increase in the proportion of earnings from operations outside of the United States, which are generally subject to a lower tax rate.
Net income increased 15 percent to $3.8 billion reflecting strong global revenue growth, gross margin expansion and a lower tax rate. Diluted earnings per share increased 17 percent to $2.16, reflecting growth in net income and the additional benefit of a decline in the weighted average diluted common shares outstanding.
MAY 31, 2016 BALANCE SHEET REVIEW
Inventories for NIKE, Inc. were $4.8 billion, up 12 percent from May 31, 2015, driven by a 6 percent increase in NIKE Brand wholesale unit inventories, increases in average product cost per unit, and growth in our DTC business, partially offset by changes in the value of inventories due to foreign currency exchange rates.
Cash and short-term investments were $5.5 billion, $467 million lower than last year as growth in net income and proceeds from the issuance of debt in the second quarter were more than offset by share repurchases, investments in infrastructure and working capital, higher dividends, and a reduction in collateral received from counterparties to foreign currency hedging instruments.
SHARE REPURCHASES
During the fourth quarter, NIKE, Inc. repurchased a total of 9.0 million shares for approximately $540 million as part of the four-year, $12 billion program approved by the Board of Directors in November 2015. As of the end of fiscal 2016, a total of 20.1 million shares had been repurchased under this program for approximately $1.2 billion, at an average cost of $59.21 per share.
In fiscal 2016, NIKE, Inc. repurchased a total of 55.4 million shares for approximately $3.2 billion, at an average cost of $58.44, under the new $12 billion program currently in use as well as the previous $8 billion program approved by the Board of Directors in September 2012.
FUTURES ORDERS
As of May 31, 2016, worldwide futures orders for NIKE Brand athletic footwear and apparel scheduled for delivery from June through November 2016 totaled $14.9 billion, 8 percent higher than orders reported for the same period last year, and 11 percent higher on a currency neutral basis.*


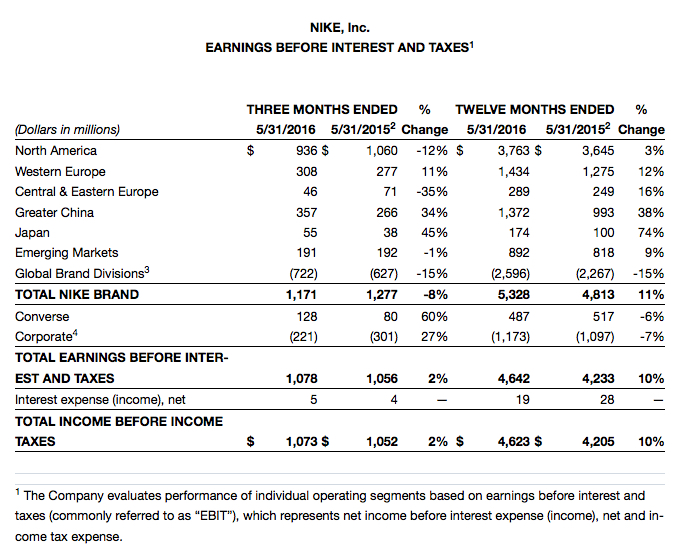


What most will miss is that nike took a hit in basketball which proves what we already know: there is good competition this year. Hopefully something meaningful will happen with consumer pricing.
Thank you for pointing it out
This info had to come out, especially with the bad news about Nike’s basketball lines not doing as well as expected, with their retailers like footlocker feeling the heat. Next year with no improvement, there will be a different story told.
From what I’m seeing, if you want to hit Nike where it hurts in regards to basketball type stuff, consumers gotta cut back on Jordans. Yes, Nike basketball was down over the course of the year, but it was only by 1%. Look at all the damage UA and Adidas supposedly did this year. Even after all that, Nike only declined 7 million out of nearly 1.4 billion dollars. Meanwhile, Jordan brand this year nearly doubled Nike basketball sales, and showed dramatic growth there. Nike, Adidas, and UA all have running, basketball, football/soccer, training, golf, etc. when it comes to shoes. Nike has the advantage though because they have JB. It’s a whole line of mostly retros that the other brands don’t have and can’t come close to touching. By maintaining Jordan’s popularity, consumers are helping maintain Nike’s advantage over the other brands.
Also, Nike is showing aggressive expansion in China and Japan. Those are two huge markets with large basketball followings. I’m hoping with Adidas going full beast this year, and if UA can come out with another popular shoe other than the Curry, that Nike basketball will drop even as much as 10% over the course of fiscal 2016. At the end of the day though, if those JB retros keep selling, Nike can afford to take that L and still be comfortably ahead.
You’re right, Nike is quite comfortably in the lead at number one. JB and Nike together control over 90% of the athletic sportswear goods market. In that leftover 10%, all the other brands live.
Does Japan really have a huge basketball following? Where did you see this data?
I guess I should clarify what I said above. Basketball as a professional sport or regulated academic sport is not widely followed in Japan. However, from most of what I’ve read, it is popular among young people and school age individuals as a casual recreation. Additionally, one of the more popular mangas in Japan deals with basketball. So while the market there may not be currently poised for a basketball upcoming, it has the potential for one.
Thanks for clearing that up, I also read about those albeit not from very formal sources (more from magazines or articles online) so I didn’t know how legitimate they were. Add in the fact that while I was in Japan last year, I didn’t see a lot of basketball shoes being offered in sports stores, even in Nike. They seemed to be more into runners and/or lifestyle wear.
Very good read. Just curious as to what “demand creation” means?
Demand creation is exactly what it sounds like: brands spend money advertising or seeding their products to create demand for them.
I see. I didn’t know companies did that. Is that common practice in this industry, or in other industries as well? I would assume those kinds of expenses would fall under a broader expense line item related to marketing.
Every brand is doing it, not just sneaker brands, but any big brand — Louis V, Under Armour, Nike, Samsung, Apple, etc. Every dollar is kept track of (generally).