- Second Quarter Net Revenues Increased 28% to $1.0 Billion
- Reiterates 2016 Net Revenues Outlook of Approximately $4.925 Billion (+24%)
- Reiterates 2016 Operating Income Outlook Range of $440 Million to $445 Million (+8% to 9%)
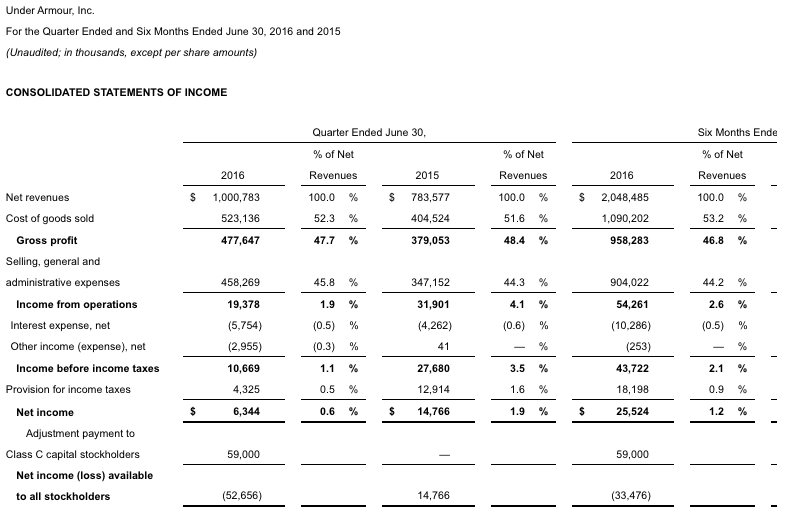
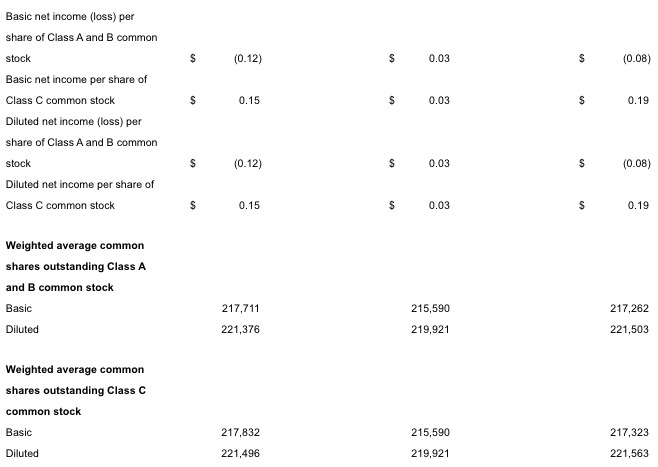
Under Armour, Inc. today announced financial results for the second quarter ended June 30, 2016. Net revenues increased 28% in the second quarter of 2016 to $1.0 billion compared with net revenues of $784 million in the prior year’s period. Operating income decreased 39% in the second quarter of 2016 to $19 million, inclusive of a $23 million impairment related to the liquidation of Sports Authority, compared with $32 million in the prior year’s period. Net income decreased 58% in the second quarter of 2016 to $6 million compared with $15 million in the prior year’s period. For the second quarter of 2016 the company realized diluted loss per share of $0.12 for Class A and B shares and diluted earnings per share of $0.15 for Class C shares, reflecting the impact of a $59 million stock dividend paid to Class C shareholders during the quarter. If the Class C stock dividend had not been paid, non-GAAP diluted earnings per share for all classes for the second quarter would have been $0.01 per share, inclusive of $0.03 impact from the impairment related to the Sports Authority liquidation. This compares with diluted earnings per share of $0.03 for all classes in the prior year’s period.
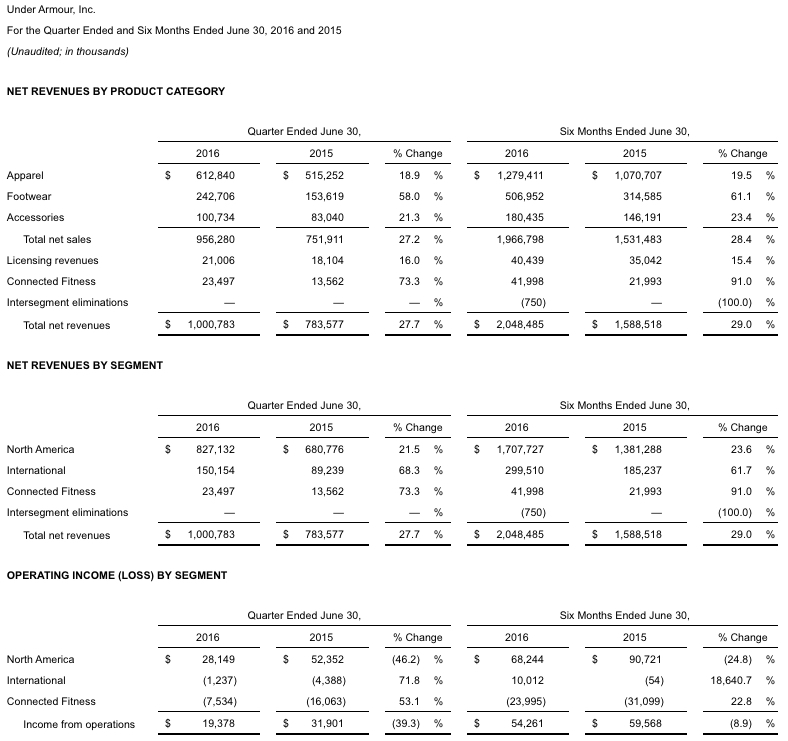
During the second quarter, wholesale net revenues grew 27% year-over-year to $635 million compared to $501 million in the prior year’s period, while Direct-to-Consumer net revenues grew 28% year-over-year to $321 million compared to $251 million in the prior year’s period. North America net revenues for the second quarter grew 22% year-over-year. International net revenues, which represented 15% of total net revenues for the second quarter, grew 68% year-over-year, or 72% on a currency neutral basis.
Within product categories, apparel net revenues increased 19% to $613 million compared with $515 million in the same period of the prior year, led by growth in men’s training, women’s training and golf. Footwear net revenues increased 58% to $243 million from $154 million in the prior year’s period, primarily reflecting the continued success of the basketball category led by the Curry signature basketball line as well as growth in running and cleated categories. Accessories net revenues increased 21% to $101 million from $83 million in the prior year’s period, driven primarily by growth in bags and headwear.
Kevin Plank, Chairman and CEO of Under Armour, Inc., stated, “The strong broad-based results posted this quarter highlight the continued demand for the Under Armour brand around the world. It also underscores the importance of diversifying our business and driving a sharper point of view with our consumers wherever they shop. In our largest category of apparel we continue to add more dimension with a sport category focus and we remain incredibly proud of the success of our international and footwear growth drivers. With the opening of 60 new international Under Armour stores so far this year, including doors on two new continents this quarter, our international business continues to expand and to resonate with the global athlete. The Stephen Curry signature line has continued to drive strong momentum for the brand and our pinnacle football product, the Highlight Cleat, continues to lead the market.”
Gross margin for the second quarter of 2016 was 47.7% compared with 48.4% in the prior year’s period, primarily reflecting negative impacts of approximately 130 basis points from sales mix driven by strong growth in footwear and international, partially offset by approximately 50 basis points from improved product cost margins. Selling, general and administrative expenses grew 32% to $458 million compared with $347 million in the prior year’s period. This increase includes the impact of the one-time impairment related to the Sports Authority liquidation and continued investments in Direct-to-Consumer and overall headcount to support the Company’s strategic initiatives.
Balance Sheet Highlights
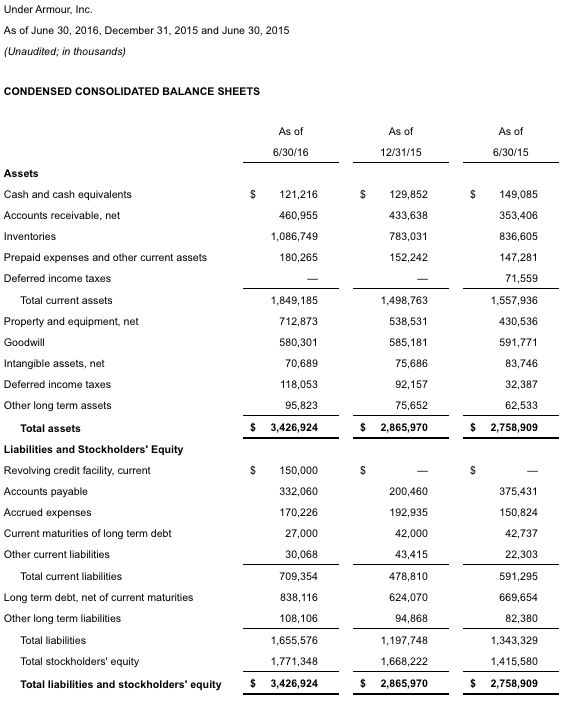
Cash and cash equivalents was $121 million at June 30, 2016 compared with $149 million at June 30, 2015. The prior year amount was previously reported as $171 million before giving effect to the reclassification of investments classified as cash. Inventory at June 30, 2016 increased 30% to $1.1 billioncompared with $837 million at June 30, 2015. Total debt increased 42% to $1.0 billion at June 30, 2016 compared with $712 million at June 30, 2015.
Class C Stock Dividend
In June 2016, the Company paid a $59 million stock dividend to the holders of Class C common stock in the form of approximately 1.47 million shares of Class C common stock and $2.9 million of cash in lieu of fractional shares in connection with the shareholder litigation regarding the creation of Class C common stock. This dividend was allocated to the numerator for calculating net income per share of Class C common stock with the remaining undistributed earnings allocated on a pro rata basis to Class A, Class B and Class C common stock based on the number of shares used in the per share computation for each class of stock. The weighted-average share impact of the dividend is included in the denominator of both basic and diluted net income per share computations for the three and six months ended June 30, 2016.
Current 2016 Outlook
Based on current visibility, the Company expects 2016 net revenues of approximately $4.925 billion, representing growth of 24% over 2015, and 2016 operating income in the range of $440 million to $445 million, representing growth of 8% to 9% over 2015. Below the operating line, the Company expects interest expense of approximately $32 million, an effective full year tax rate of approximately 36.5%, and fully diluted weighted average shares outstanding of approximately 448 million.
Mr. Plank concluded, “In 2016, our ability to position the brand to capture the changing expectations of the consumer requires Under Armour to extend and grow in new and different ways. The authenticity we have gained with the athlete over the past 20 years has positioned Under Armour to widen our access through categories, channels, and geographies. Starting with our launch this fall of Under Armour Sportswear, which we are calling UAS, we will continue to find new opportunities to bring more consumers into the Under Armour Brand, whether that is through compelling flagship retail, new partners in wholesale, or on a digital platform. We remain focused on making all athletes better and driving consistent revenue growth quarter after quarter. I am proud of what the team has accomplished so far this year and am incredibly excited about the future of Under Armour for the rest of 2016 and beyond.”
Source: PR
If you haven’t bought under armour stock yet or are just getting into the stock market, I recommend buying ua immediately while it’s still cheap and before they explode from their sportswear line and tapping into the international markets!
This is a good tip. Best time to buy would’ve been last year but I agree, the company will be as big as swoosh, only a matter of time